婊ㄦ搗婀垮湴涓哄寘鎷漢綾誨湪鍐呯殑浼楀鐢熺墿鎻愪緵浜嗗疂璐電殑鐢熸€佺郴緇熸湇鍔″姛鑳斤紝鐒惰€岃繖涓€閲嶈鐨勭敓鎬佺郴緇熸鏃ョ泭鍙楀埌浜轟負媧誨姩鐨勫▉鑳併€傝嚜宸ヤ笟闈╁懡浠ユ潵錛屽ぇ姘斾腑鐨勪簩姘у寲紕籌紙CO2錛夋祿搴︿粠280 ppm澧炲姞鍒?/span>410 ppm錛岄璁″埌2100騫村皢瓚呰繃900 ppm銆傚湪闄嗗湴鐢熸€佺郴緇熶腑錛?/span>CO2嫻撳害鐨勪笂鍗囬€氬父浼氫績榪?/span>C3妞嶇墿鐨勫厜鍚堜綔鐢ㄥ拰鍒濈駭鐢熶駭鍔涳紝浠庤€屽鑷存鐗╁艦鎬佺殑鍙樺寲銆備絾鏄紝涓庢湪鏈鐗╂垨鍐滀綔鐗╃浉姣旓紝闈炴湪鏈厠闅嗘鐗╁CO2鍗囬珮鐨勫艦鎬佸搷搴旀ā寮忓嵈椴滄湁鐮旂┒銆傝€冭檻鍒扮粷澶у鏁扮洂娌兼琚兘鏄厠闅嗘鐗╋紝涓斿叾褰㈡€佸彉鍖栧皢鐩存帴鍐沖畾婊ㄦ搗婀垮湴鐢熸€佺郴緇熺殑緇撴瀯鍜屽姛鑳斤紝鍗㈣挋鍗氬+鍙婂悎浣滆€呭湪浣嶄簬緹庡浗涓滄搗宀?/span>Chesapeake Bay鐨勭洂娌兼箍鍦板紑灞曚簡30浣欏勾鐨?/span>CO2鍊嶅瀹為獙騫舵祴閲忎簡瓚呰繃20涓囨牚鐨勬鐗╁艦鎬佹暟鎹紝浠ユ帰璁ㄥ叏鐞冨彉鍖栬儗鏅笅鐩愭布婀垮湴妞嶇墿褰㈡€佸彉鍖栧鐢熸€佺郴緇熺粨鏋勫拰鍔熻兘鐨勫獎鍝嶃€?/span>
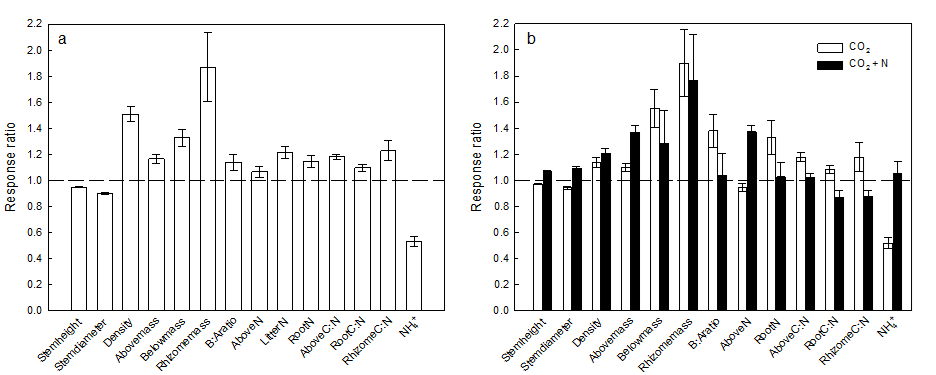
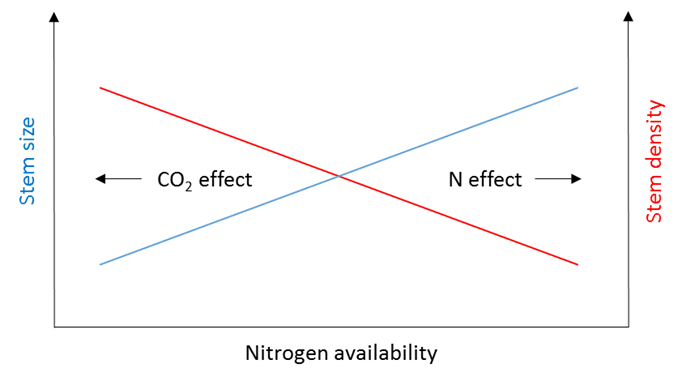
欏圭洰緇勭爺絀惰〃鏄庯紝30騫寸殑鍊嶅CO2鎺у埗瀹為獙鎻愰珮浜嗙洂娌兼箍鍦扮敓鎬佺郴緇熷垵綰х敓浜у姏鍜屾琚殑瀵嗗害錛屼絾闄嶄綆浜嗕紭鍔垮厠闅嗙墿縐?/span>Schoenoplectus americanus鐨勮寧縐嗙洿寰勫拰楂樺害錛?/span>Fig. 1錛夈€傝緝灝忥紝杈冨瘑鐨勮寧縐嗕笌鏍瑰拰鏍圭姸鑼庣殑鎵╁紶鏈夊叧錛屼互鍑忚交CO2鍊嶅鏉′歡涓嬪鑷寸殑姘紙N錛夐檺鍒訛紝榪欎竴鐐瑰彲鐢辮寧縐嗐€佺粏鏍廣€佹牴鐘惰寧鍜屽噵钀界墿涓崌楂樼殑N鍚噺錛屽鍔犵殑妞嶇墿緇勭粐紕蟲愛姣旓紙C錛?/span>N ratio錛夛紝鍜岄檷浣庣殑鍦熷¥瀛旈殭姘存棤鏈烘愛鍚噺鎵€璇佹槑錛?/span>Fig. 2a錛夈€傚湪鍙︿竴緇勫€嶅CO2鍜屾愛娣誨姞錛?/span>CO2 + N錛夋帶鍒跺疄楠屼腑錛?/span>Schoenoplectus americanus鐨勫艦鎬佸彉鍖栧緱鍒板弽杞紝鍗寵寧縐嗙洿寰勫拰楂樺害鍚屾椂澧炲姞錛?/span>Fig. 2b錛夈€傚洜姝ゆ垜浠緱鍑猴紝鍦熷¥鏈夋晥姘槸鎺у埗妞嶇墿褰㈡€佸CO2嫻撳害鍙樺寲鍝嶅簲鐨勫叧閿洜瀛愶紙Fig. 3錛夈€?/span>
鍚屾椂錛岄」鐩粍鏍規嵁鐩愭布妞嶈褰㈡€佸鍜岀敓鐗╅噺鐨勫彉鍖栵紝妯″瀷妯℃嫙浜嗘湭鏉ユ皵鍊欏彉鍖栧拰嫻峰鉤闈笂鍗囨儏鏅笅婊ㄦ搗婀垮湴鐢熸€佺郴緇熷湡澹ゆ矇縐墿鐨勭Н鑱氬搷搴旀ā寮忥紝緇撴灉琛ㄦ槑CO2鍜?/span>N鐨勪氦浜掍綔鐢ㄨ兘淇冭繘鐩愭布婀垮湴鐨勬姮鍗囷紙Table 1錛夛紝浠庤€屼負婊ㄦ搗婀垮湴鐢熸€佺郴緇熷簲瀵規搗騫抽潰涓婂崌鎻愪緵鏈夊姏鐨勪繚闅溿€?/span>
璇ョ爺絀舵垚鏋滃彂琛ㄥ湪鏈€鏂頒竴鏈熺殑銆?/span>Nature Climate Change銆嬫潅蹇椼€?/span>
鍏ㄦ枃閾炬帴錛?/span>
https://www.nature.com/articles/s41558-019-0582-x
DOI錛?/span>https://doi.org/10.1038/s41558-019-0582-x

Fig. 1 Elevated CO2 responses of individual stem of S. americanus in the C3 community of Experiment 1 from 1987 to 2016. The mean 鹵 s.e.m. (n=5 replicate plots) of stem density (a), stem biomass (b), stem height (c), and stem diameter (d) are shown separately for ambient CO2 (open circles) and elevated CO2 chambers (filled circles).

Fig. 2 The response ratios of key parameters from the two experiments. Elevated CO2 caused symptoms of N limitation such as increased root:shoot ratio and lower available soil N, effects that were mitigated by N addition. Each bar (elevated CO2: open bars, elevated CO2 plus N addition: filled bars) is the mean (鹵 s.e.m.) response ratio (Elevated/Ambient) in Experiment 1 (a) and Experiment 2 (b) across all years in the record.

Fig. 3 A conceptual framework for the responses of clonal plant aboveground growth pattern to CO2 enrichment and nitrogen availability.
Table 1. Impacts of elevated CO2 and N on plant growth and accretion. Mean values for frontal area per unit volume (m-1), belowground organic accretion (mm yr-1, from Pastore et al. 2017), total belowground productivity (g m-2 yr-1), stem density (shoot m-2), aboveground biomass (g m-2), and modeled aboveground mineral accretion (mm yr-1) for Experiments 1 and 2. Means 鹵 s.e.m. with the same letter in the same column and experiment are not significantly different from one another (A, B for Experiments 1 and a, b, c for Experiments 2).
銆€ |
Frontal Area |
Measured Belowground Organic Accretion* |
Belowground productivity |
Stem density |
Aboveground Biomass |
Modeled Aboveground Mineral Accretion |
Experiment 1 |
|
|
|
|
|
|
Ambient |
2.2 (0.2)A |
N/A |
269 (21) |
538 (25) |
497 (33) |
4.5 (0.1)A |
CO2 |
2.4 (0.2)B |
N/A |
349 (28) |
784 (30) |
564 (33) |
5.7 (0.1)B |
Experiment 2 |
|
|
|
|
|
|
Ambient |
2.4 (0.2)a |
0.46 (0.3) |
143 (23) |
527 (23) |
587 (52) |
4.2 (0.1)a |
CO2 |
2.6 (0.2)a,b |
1.84 (0.4) |
228 (25) |
598 (30) |
645 (66) |
4.9 (0.1)b |
CO2+N |
3.2 (0.3)b |
1.70 (0.6) |
187 (35) |
633 (31) |
803 (83) |
5.7 (0.1)c |
N |
2.3 (0.2)a |
1.81 (0.5) |
110 (15) |
503 (28) |
555 (60) |
4.4 (0.1)a |